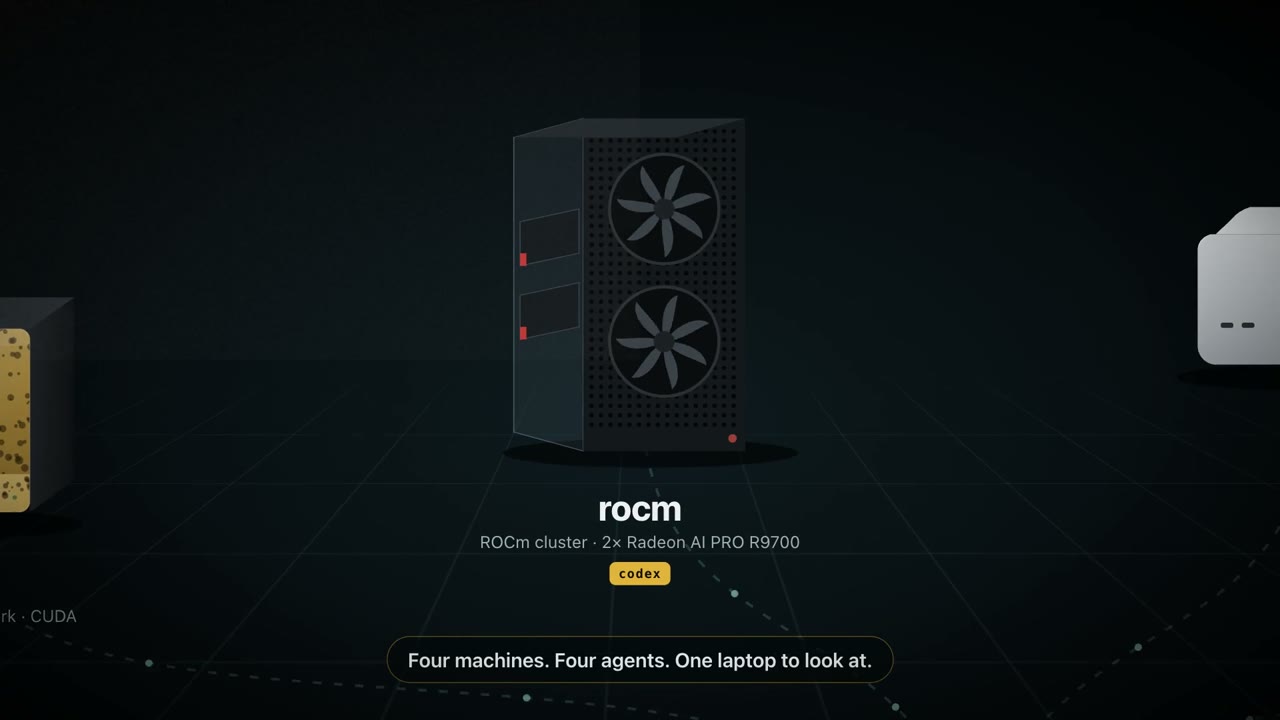
What people send
What to send to it
Profiler output
rocprofv3 kernel tables, omniperf views, and traces go to the agent working on the kernel.
Build and runtime errors
HIP compiler errors and stack traces from a browser or remote desktop, as images.
Serving dashboards
Throughput and latency panels from your inference server while the agent tunes it.
Trace files
Drop exported JSON traces or logs on the nub; they arrive next to the code.
Set it up
Five minutes, nothing to install over there.
Install dotshot on your Mac
Download the notarized DMG from GitHub Releases and allow Screen Recording in its setup. Nothing gets installed on the other machine.
Make sure this Mac can reach it with a key
ssh -o BatchMode=yes dev@rocm-box true && echo readyNo key there yet? Run
ssh-copy-id dev@rocm-boxonce. Tailscale names and~/.ssh/configaliases (including ones with aProxyCommand) work, because dotshot uses your SSH configuration.Add it as a destination
In setup, or from Terminal (or let your agent do it with the setup skill):
DS=/Applications/dotshot.app/Contents/Resources/dotshot-capture.sh "$DS" add rocm dev@rocm-box '~/inbound' "$DS" check rocmcheckcreates a private folder, verifies the key and SFTP, and saves the absolute path your agent will see.Capture
Press ⌃⌥⌘S and drag, or ⌃⌥⌘V to record. The file lands on the machine and its absolute path is on your clipboard.
- Works the same for Radeon workstations and Instinct servers: dotshot never touches the GPU stack.
- Agents on ROCm boxes often run with broad permissions. Treat captures of untrusted pages as untrusted input.
- Behind a bastion? Put the
ProxyJumpin~/.ssh/configand use that alias.
Also works with
One shortcut for the whole fleet.
Every guide uses the same app: add each machine once, then switch from the pill, a drop tile, or a dotshot:// link.